Stock Coverage is a functionality which enables users to calculate how long a store is able to continue selling items or groups of items given a sales history and inventory. This is an important information to manage season based or non reoccurring items with a defined lifecycle end.
- If the Stock Coverage is too high we will likely end with excessive inventory at the end of season.
- If the Coverage is too low there is a risk of running out of stock before season ends.
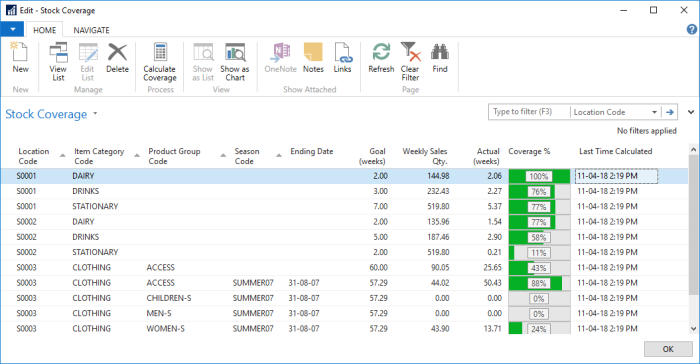
The Stock Coverage page gives a quick overview on item category and product group level about coverage goals and actual coverage - information on item level can be retrieved via the Lifecycle Planning Worksheet.
Stock Coverage page can be accessed from the following pages:
- Location
- Item Category
- Product Group
- Season
Note: The Stock Coverage data in the demo database is created based on historical sales data. In order to recreate this data, set the work date to 26-08-2007 before you perform the Calculate Coverage action.
A Coverage Goal (weeks) can be setup in the Stock Coverage page per item category or product group, as well as for a specific season. Please refer to How to: Setup Stock Coverage for more information on how Stock Coverage can be setup.
The calculation of the actual Stock Coverage is done in three steps:
- Calculation of current Inventory.
- Calculation of Weekly Sales Qty. based on the quantity sold in the calculation period.
- Calculation of the coverage Actual (weeks) which is (Weekly Sales Qty. divided by Inventory).
This value expresses, how many weeks we are able to continue selling, if we do not get any replenishment for those items.
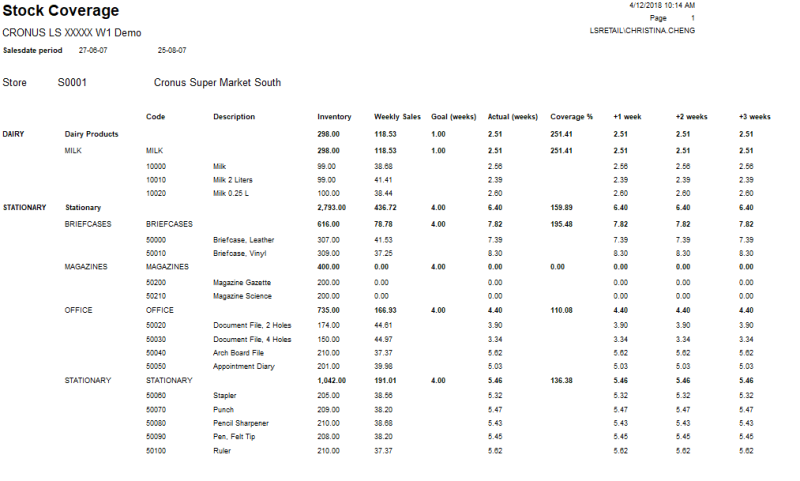
Stock Coverage Report
This report gives information on:
- Inventory - current inventory
- Weekly Sales - quantity sold in the calculation period
- Goal (weeks) - stock coverage goal defined in weeks by user
- Actual (weeks) - calculated actual coverage
- Coverage % - calculated coverage percentage
- +1 week - calculated actual coverage plus expected received stock in next 1 week
- +2 weeks - calculated actual coverage plus expected received stock in next 2 weeks
- +3 weeks - calculated actual coverage plus expected received stock in next 3 weeks.
How to use
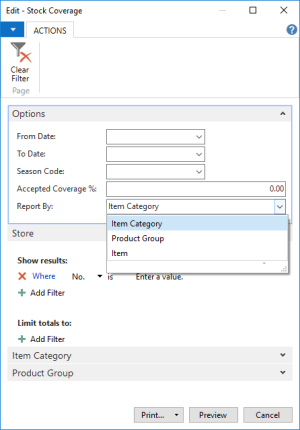
- Click LS Retail – Replenishment - General - Reports and Analysis - Stock Coverage.
- Select a From Date and To Date of the sales history period.
- Select a Season Code if you want to display only the seasonal items.
- Define an Accepted Coverage % if there is any.
- Select the option Report By to have different grouping information.
- Click Print or Preview.
- Sample of report output:
Tasks
The following table describes a sequence of tasks with links to the topics that describe them. These tasks are listed in the order in which they are generally performed.
| To | See |
|---|---|
| Setup Stock Coverage | How to: Set Up Stock Coverage |
| Calculate actual Stock Coverage | How to: Calculate Stock Coverage |
| See Coverage Info on Item level with the Lifecycle Planning Worksheet | Lifecycle Planning Worksheet |
See Also